China’s export machine is grabbing more of the global market

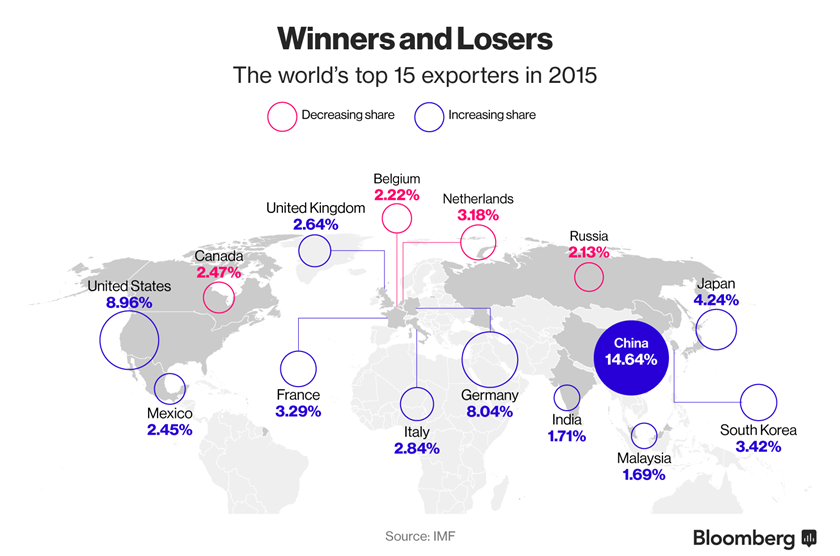
China is eating up a larger chunk of the world’s shrinking trade pie.
Brushing off rising wages, a shrinking workforce and intensifying competition from lower cost nations from Vietnam to Mexico, China’s global export share climbed to 14.6 percent last year from 12.9 percent a year earlier. That’s the highest proportion of world exports ever in International Monetary Fund data going back to 1980.


Yet even as its export share climbs globally, manufacturing’s slice of China’s economy is waning as services and consumption emerge as the new growth drivers. For the global economy, a slide in China’s exports this year isn’t proving any respite as an even sharper slump in its imports erodes a pillar of demand.

Those trends are likely to be replicated in August data due Thursday. Exports are estimated to fall 4 percent from a year earlier and imports are seen dropping 5.4 percent, leaving a trade surplus of $58.85 billion, according to a survey of economists by Bloomberg News as of late Tuesday.
While China’s advantage in low-end manufacturing has been seized upon by Donald Trump’s populist campaign for the U.S. presidency, the shift into higher value-added products from robots to computers is also pitting China against developed-market competitors from South Korea to Germany. A weaker yuan risks exacerbating global trade tensions, which became a hot button issue at the G-20 meeting in Hangzhou over cheap steel shipments.
“All the talk we have heard over the last few years about China losing its global competitive advantage is nonsense,” said Shane Oliver, head of investment strategy at AMP Capital Investors in Sydney. “This will all further fuel increasing trade tensions as already evident in the U.K. with the Brexit vote and in the U.S. with the support for Trump’s populist protectionist platform.”


China is also facing opposition to its global shopping spree and calls from bodies such as the European Union Chamber of Commerce in China for improved market access.

A key driver of China’s export share gains is its move toward more sophisticated assembly, especially in electronics, which eliminates the need to source components from a vast supply chain across Asia, said Frederic Neumann, co-head of Asian economic research at HSBC Holdings Plc in Hong Kong. That’s hurting companies and economies from Singapore to Thailand, Malaysia, Taiwan and South Korea, said Neumann.
The government is subsidizing higher technology industries including new advanced information technology, robotics, and new energy vehicles under its “Made in China 2025” plan. More is to come as President Xi Jinping’s blueprint envisions global competitiveness within a decade in 10 industries from machine tools and robots to advanced railway equipment and medical devices.
China increasingly is turning into an economic rival as it pushes to produce higher-value exports, said German Chancellor Angela Merkel on a trip to the nation in June. Those stern words from the leader of China’s fifth biggest trade partner pale in comparison with the rhetoric from Trump, who has accused China of raping the U.S. in “the greatest theft in the history of the world.”
“Political support for open trade and investment is evaporating globally and no one has more to lose than China,” said David Loevinger, a former China specialist at the U.S. Treasury who is now an analyst at fund manager TCW Group Inc. in Los Angeles. “China has become the bogey man for opponents of globalization.”
Trade backlash
At the G-20 meeting in Hangzhou “China took a drubbing behind the scenes over its steel exports, which have flooded global markets and become a symbol of trade imbalances that have fed resentment across nations,” said Pauline Loong, managing director at research firm Asia-analytica in Hong Kong. “Protectionism is China’s biggest worry.”
The latest IMF data for the first quarter of this year shows China’s market share edged down in January and February — notoriously volatile months because of a week-long Lunar New Year holiday — and bounced back again in March, indicating the nation’s manufacturers are set to at least hold on to previous gains. Last year, the U.S. also increased its share while Russia was the biggest decliner among the top 15 exporters as oil prices fell.
Brand restraint
But it’s not all upside for China. While it’s successfully transitioning into medium-end technologies, it has yet to make the leap into high-value-added exports, says Andrew Polk, Beijing-based head of China research at Medley Global Advisors, which advises hedge funds and other institutional investors.
“Maybe they can, but it remains an open question,” he said. “The highest value-add is in intangible items like branding. Right now, there is not really a globally branded Chinese company that stands for high quality.”
Yet even without its own Coca-Cola, Nike or Apple equivalent on the world stage, China’s export juggernaut is winning by default as other major exporters fall behind.
“After having come this far I see no reason why China’s march up the value-chain would suddenly stop,” said James Laurenceson, deputy director of the Australia-China Relations Institute at the University of Technology in Sydney. “Chinese companies are competing outside their home base against the best in the world, and winning. This points to a hyper-competitive manufacturing sector, not one losing its shine.”

Preliminary assessment of Vietnam international merchandise trade performance in December and whole year 2014

Highlights

1.  According to trade statistics of Vietnam Customs, in December of 2014, a 3.4% decrease in total external merchandise turnover of Vietnam was recorded as compared to the result of a month earlier. In which, exports went down 2.7 %, to USD 12.88 billion and imports expanded 9.7%, to USD 14.04 billion. As a result, there was a USD 1.16 billion deficit in Vietnam’s trade balance in this month.


2. Total value of Vietnam’s- trade-in-good was recorded at USD 298.24 billion, 12.9% (or USD 34.17 billion) higher than the performance of one year before. There were upwards in total value of both merchandise exports (13.7%, to USD 150.19 billion) and merchandise imports (12.1%, to USD 148.05 billion). Accordingly, from the beginning to the end of 2014, Vietnam Customs recorded the highest surplus in Vietnam’s trade balance, which reached USD 2.14 billion.
 
3. Trade data disseminated recently by Vietnam Customs announced that the total value of exportation and importation by foreign direct invested (FDI) traders reached USD 178.18 billion in total for whole year 2014, up by 14.7 % as compared to the result of 2013. Total value of FDI exportation was USD 94.0 billion, expanded by 16.1%. On import side, the total value of those companies was USD 84.18 billion, picked up by 13.1%.


Main Exports and Imports      
                  
4. The November to December of 2014 decrease in total merchandise exports was due to the downturns in telephones, mobile phones and parts thereof (down by USD 873 million), computers, electrical products and parts thereof (down by USD 428 million); rice (down  by USD 85 million). In contrast to this result, there were still sharp upturns in value of the following commodities: textiles and garments (up by USD 426 million); foot-wears (up by USD 132 million); wood and wooden products (up by USD 66 million); coffee (up by USD 63 million).


In 2014, there were more 2 exported commodities reaching over USD billion than 2013, to 23commodities. The value of these was expanded by 13.8%, to USD 128.88 billion in total as compared to the result of those in 2013 and accounted for 85.8% total merchandise exports value.      
The performance growth in total exports value of 2014 as compared to that of 2013 was contributed by the upwards of the following goods: textiles and garments (up by USD 3.02 billion); foot-wears (up by USD 1.94 billion); machine, equipment, tools and instruments (up by USD 1.29 billion); fishery products (up by USD 1.14 billion); computers, electrical products and parts thereof (up by USD 838 million)…
    
5 The following Table released by Vietnam Customs illustrates 10 biggest major imported commodities of Vietnam from rest of the world in December 2014. The leading imported products of the country from the world market included: Machine, equipment, tools and instruments (USD 2,408 million); computers, electrical products, spare-parts and components thereof (USD 1,829 million);textiles, leather and foot-wears materials and auxiliaries group (USD 1,460 million); iron and steel (USD 863 million); telephones, mobile phones and parts thereof (USD 1,722 million); …
 
 
In 2014, there were more 5 imported commodities reaching over USD billion than 2013, to 29 commodities. The value of these reached USD 127.05 billion in total as compared to the result of those in 2013 and accounted for 85.8% total merchandise exports value.      
 
The performance growth in total imports value of 2014 as compared to that of 2013 was contributed by the upwards of the following goods: machine, equipment, tools and instruments (up by USD 3.82 billion); computers, electrical products and parts thereof (up by USD 1.44 billion); iron and steels (up by USD 1.12 billion); fabrics (up by USD 1.09 billion);..
On the other hand, there were strong decrease in value of the following goods: other means of transportation, parts and accessories thereof (down by USD 849 million); crude oil (down by USD 571 million) and fertilizers (down by USD 466 million).
 
Trading Partners
 
6. In 2014, Vietnamese merchandise trade with trading partners in Asia was totaled USD 197.26 billion in value terms, which moved up 11.7%  as compared to the same period of one year before. Trade-in-goods of Vietnam with America was followed, which reached USD 46.74 billion and increased by 23.6%. The values of other continents were: Europe: USD 42.59 billion, up by 7.7%; Oceania: USD 6.93 billion, up by 19.1% and Africa: USD 4.71 billion, up by 9.7% in comparison with the performance of 2013.
 
 
7. From January to December of 2014, Vietnam traded with over 200 trading partners. There were 28 exporting markets and 18 importing markets with over USD 1 billion revenue.
 
Value level Exports Imports
Markets Value
(Mil.USD)
Markets Value
(Mil.USD)
Above 1 Bil. USD 28 133.98 18 132.78
500 Mil.USD – 1 Bil.USD 7 4.6 9 5.83
100 Mil.USD – 500 Mil.USD 32 7.4 28 6.56
Below 100 Mil. USD 171 4.21 183 2.88
 
                                                                                                Source: Vietnam Customs
 
For Jan – Dec period of 2014, there were 17 exporting markets with trade surplus of over USD 1 billion. The United States of America posted the biggest trade surplus of USD 22.37 billion.  United Arab Emirates and Hong Kong posted the second trade surplus of USD 4.16 billion and then: Netherland (USD 3.22 billion); United Kingdom (USD 3 billion); Germany (USD 2.54 billion)…


8. In 2014, there were 6 importing markets with trade deficit of over 1 billion. China was the market that Vietnam had the largest trade deficit with USD 28.96 billion. The following positions were: Republic of Korea (USD 14.6 billion); Taiwan (USD 8.78 billion); Singapore (USD 3.93 billion); Thailand (USD 3.86 billion)…


Incoterms

INCOTERMS are a set of three-letter standard terms most commonly used in international contracts for the sale of goods. It is essential that you are aware of your terms of trade prior to shipment.

EXW – EX WORKS (…named place of delivery)The Seller’s only responsibility is to make the goods available at the Seller’s premises. The Buyer bears the full cost and risks of moving the goods from there to destination.

FCA – FREE CARRIER (…named place of delivery)The Seller delivers the goods, cleared for export, to the carrier selected by the Buyer. The Seller leads the goods if the carrier pickup is at the Seller’s premises. From that point, the Buyer bears the cost and risks of moving the goods to destination.

CPT – CARRIAGE PAID TO (… named place of destination)The Seller pays for moving the goods to destination. From the time the goods are transferred to the first carrier, the Buyer bears the risks of loss or damage.

CIP – CARRIAGE AND INSURANCE PAID TO – (… named place of destination)The Seller pays for moving the goods to destination. From the time the goods are transferred to the first carrier, the buyer bears the risks of the loss or damage. The Seller however, purchases the cargo insurance.

DAT – DELIVERED AT TERMINAL (…named terminal at the port or place of destination)The Seller delivers when the goods, once uploaded from the arriving means of transport, are placed at the Buyer’s disposal at a named terminal at the named port or place of destination. “Terminal” includes any place, whether covered or not, such as quay, warehouse, container yard or road, rail or air cargo terminal. The Seller bears all risks involved in the bringing of goods to the unloading them at the terminal at the named port or place of destination.

DAP – DELIVERED AT PLACE (…named place of destination)The Seller delivers when the goods are placed at the Buyer’s disposal on the arriving means of transport ready for uploading at the named place of destination. The Seller bears all the risks involved in bringing the goods to the named place.

DDP – DELIVERED DUTY PAID (…named place)The Seller delivers the goods – cleared for import – to the Buyer at destination. The Seller bears all the cost and risks of moving the goods to destination, including the payment of Customs duties and taxes.

MARITIME – ONLY TERMS

FAS – FREE ALONGSIDE SHIP (… named port of shipment)The Sellerdelivers the goods to the origin port. From that point, the Buyer bears all the costs and the risks of loss or damage.

FOB – FREE ON BOARD (… named port of shipment)The Seller delivers the goods on board the ship and clears the goods for export. From that point, the Buyer bears all the cost and risks of loss or damage.

CFR – COST AND FREIGHT (… named port of destination)The Seller clears the goods for export and pays the cost of moving the goods to destination. The Buyer bears all the risks of loss or damage.

CIF – COST INSURANCE AND FREIGHT – (…named port of destination)The Seller clears the goods for export and pays the cost of moving the goods to the port of destination. The Buyer bears all the risks of loss and damage. The Seller however, purchases the cargo insurance.

Container specifications

External Dimensions

Length Width Height
20′ Standard
6.058 m 2.438 m 2.591 m
20′ 8′ 8′ 6”
40′ Standard
12.192 m 2.438 m 2.591 m
40′ 8′ 8′ 6”
40′ High Cube
12.192 m 2.438 m 2.896 m
40′ 8′ 9′ 6”

STANDARD CONTAINERS

20′ STANDARD STEEL CONTAINER – 22 G1

20' Standard Steel Container - 22 G1

INTERNAL DIMENSIONS DOOR
L W H W H
5.898 m 2.352 m 2.393 m 2.340 m 2.280 m
19′ 4 1364 7′ 8 1932 7′ 10 732 7′ 8 18 7′ 5 4964
CUBIC CAPACITY MAXIMUM PAYLOAD TARE WEIGHT MAXIMUM GROSS
33.20 m3 28,260 kgs 2,220 kgs 30,480 kgs
1,172.4 Cft 62,302 Lbs 4,894 Lbs 67,196 Lbs

40′ STANDARD STEEL CONTAINER – 42 G1

40' Standard Steel Container - 42 G1

INTERNAL DIMENSIONS DOOR
L W H W H
12.032 m 2.352 m 2.393 m 2.340 m 2.280 m
39′ 5 4564 7′ 8 1932 7′ 10 732 7′ 8 18 7′ 5 4964
CUBIC CAPACITY MAXIMUM PAYLOAD TARE WEIGHT MAXIMUM GROSS
67.70 m3 28,860 kgs 3,640 kgs 32,500 kgs
2,390.8 Cft 63,625 Lbs 8,024 Lbs 71,650 Lbs

40′ HIGH CUBE STEEL CONTAINER – 45 G1

40' High Cube Steel Container - 45 G1

INTERNAL DIMENSIONS DOOR
L W H W H
12.032 m 2.352 m 2.698 m 2.340 m 2.585 m
39′ 5 4564 7′ 8 1932 8′ 10 732 7′ 8 18 8′ 5 4964
CUBIC CAPACITY MAXIMUM PAYLOAD TARE WEIGHT MAXIMUM GROSS
76.40 m3 28,660 kgs 3,840 kgs 32,500 kgs
2,698 Cft 63,184 Lbs 8,465 Lbs 71,650 Lbs

OPEN TOP CONTAINERS

20′ OPEN TOP STEEL CONTAINER – 22 U1

20' Open Top Steel Container - 22 U1

INTERNAL DIMENSIONS DOOR
L W H W H
5,902 m 2.350 m 2.348 m 2.340 m 2.280 m
19′ 4 2364 7′ 8 3364 7′ 8 716 7′ 8 18 7′ 5 4964
ROOF HEADER
Btw Top Rails Btw Top Headers Btw Troughs Btw Stubs
W L L W
2,252 m 5.674 m 5.378 m 1.640 m
7′ 4 2132 18′ 7 2564 17′ 7 4764 5′ 4 916

Removable swing header capable of swinging 90 degs. to either side.

MAXIMUM PAYLOAD TARE WEIGHT MAXIMUM GROSS
28,180 Kgs 2,300 Kgs 30,480 Kgs
62,126 Lbs 5,070 Lbs 67,196 Lbs

40′ OPEN TOP STEEL CONTAINER – 42 U1

40' Open Top Steel Container - 42 U1

INTERNAL DIMENSIONS DOOR
L W H W H
12.036 m 2.350 m 2.348 m 2.340 m 2.280 m
39′ 5 5564 7′ 8 3364 7′ 8 716 7′ 8 18 7′ 5 4964
ROOF HEADER
Btw Top Rails Btw Top Headers Btw Troughs Btw Stubs
W L L W
2,232 m 11.798 m 11.512 m 1.940 m
17′ 3 78 38′ 8 3164 37′ 9 1564 6′ 4 38

Removable swing header capable of swinging 90 degs. to either side.

MAXIMUM PAYLOAD TARE WEIGHT MAXIMUM GROSS
26,680 Kgs 3,800 Kgs 30,480 Kgs
58,819 Lbs 8,377 Lbs 67,196 Lbs

FLAT RACK CONTAINERS

20′ COLLAPSIBLE FLAT RACK – 22 P3

20' Collapsible Flat Rack - 22 P3

INTERNAL DIMENSIONS BTW HEADERS BTW CORNERS
L W H L L W
5.96 m 2.40 m 2.29 m 5.85 m 5.42 m 2.06 m
19′ 7” 7′ 10” 7′ 6” 19′ 2” 17′ 9” 6′ 9”
MAXIMUM PAYLOAD TARE WEIGHT MAXIMUM GROSS
37,000 Kgs 3,000 Kgs 40,000 Kgs
81,571 Lbs 6,613 Lbs 88,184 Lbs

40′ COLLAPSIBLE FLAT RACK – 42 P3

40' Collapsible Flat Rack - 42 P3

INTERNAL DIMENSIONS BTW HEADERS BTW CORNERS
L W H L L W
11.65 m 2.37 m 1.96 m 12.06 m 11.66 m 2.22 m
38′ 3” 7′ 9” 6′ 5” 39′ 7” 38′ 3” 7′ 3”
MAXIMUM PAYLOAD TARE WEIGHT MAXIMUM GROSS
44,650 Kgs 5,250 Kgs 50,000 Kgs
98,436 Lbs 11,574 Lbs 110,231 Lbs

REEFER CONTAINERS

20′ REEFER STEEL CONTAINER – 22 R1

20' Reefer Steel Container - 22 R1

INTERNAL DIMENSIONS DOOR
L W H W H
5.456 m 2.294 m 2.16 m 2.290 m 2.264 m
17′ 10 5164 7′ 6 516 7′ 1 364 7′ 6 532 7′ 5 964

NOTE: Inside height is to maxi stowage height.

CUBIC CAPACITY MAXIMUM PAYLOAD TARE WEIGHT MAXIMUM GROSS
28.40 m3 27,540 kgs 2,940 kgs 30,480 kgs
1,002.9 Cft 60,715 Lbs 6,481 Lbs 67,196 Lbs

40′ HIGH CUBE REEFER STEEL CONTAINER – 45 R1

40' High Cube Reefer Steel Container - 45 R1

INTERNAL DIMENSIONS DOOR
L W H W H
11.59 m 2.288 m 2.40 m 2.290 m 2.569 m
38′ 0 1964 7′ 6 564 7′ 10 3164 7′ 6 532 8′ 5 964

NOTE: Inside height is to maxi stowage height.

CUBIC CAPACITY MAXIMUM PAYLOAD TARE WEIGHT MAXIMUM GROSS
67.50 m3 29,400 kgs 4,600 kgs 34,000 kgs
2,383.7 Cft 64,815 Lbs 10,141 Lbs 74,957 Lbs

Air Freight Container Types and Dimensions

The following guide to airfreight containers, also called Unit Load Devices (ULD), has been developed from materials supplied by IATA (International Air Transport Association) and the ATA (Air Transport Association of America). This guide lists and illustrates the average external dimensions and weight limitations of the primary containers in use today. Exact dimensions and weight limitations will vary by manufacturer and availability will vary by air carrier and tradelane.

China Airlines launches three new freight route

The new weekly service to Xiamen has started from September 4, Nanjing weekly service will start on 11 September.

Freighter services twice a week between Taoyuan and Fuzhou will be deployed by the end of September, helping China Airlines becomes the first airline to exploit cargo freighters from Fuzhou Changle International Airport to the city this opened in 1997.

China_Airlines_747-400_at_HKG

China_Airlines_747-400_at_HKG

China Airlines has operated cargo flights across the Taiwan Strait to Shanghai-Pudong and Guangzhou.

The airline plans to operate a total of 12 weekly cargo flights across the strait to five different destinations on the mainland.

CAL currently has a fleet of 20 dedicated freighters B747-400F, and according to the International Air Transport Association, the airline is the international freight tenth largest in the world.

Preliminary assessment of Vietnam international merchandise trade performance in December and whole year 2014

Highlights

1.  According to trade statistics of Vietnam Customs, in December of 2014, a 3.4% decrease in total external merchandise turnover of Vietnam was recorded as compared to the result of a month earlier. In which, exports went down 2.7 %, to USD 12.88 billion and imports expanded 9.7%, to USD 14.04 billion. As a result, there was a USD 1.16 billion deficit in Vietnam’s trade balance in this month.
 
 image002
 
2. Total value of Vietnam’s- trade-in-good was recorded at USD 298.24 billion, 12.9% (or USD 34.17 billion) higher than the performance of one year before. There were upwards in total value of both merchandise exports (13.7%, to USD 150.19 billion) and merchandise imports (12.1%, to USD 148.05 billion). Accordingly, from the beginning to the end of 2014, Vietnam Customs recorded the highest surplus in Vietnam’s trade balance, which reached USD 2.14 billion.
 
3. Trade data disseminated recently by Vietnam Customs announced that the total value of exportation and importation by foreign direct invested (FDI) traders reached USD 178.18 billion in total for whole year 2014, up by 14.7 % as compared to the result of 2013. Total value of FDI exportation was USD 94.0 billion, expanded by 16.1%. On import side, the total value of those companies was USD 84.18 billion, picked up by 13.1%.
 
 image004
 
 
Main Exports and Imports      
                  
4. The November to December of 2014 decrease in total merchandise exports was due to the downturns in telephones, mobile phones and parts thereof (down by USD 873 million), computers, electrical products and parts thereof (down by USD 428 million); rice (down  by USD 85 million). In contrast to this result, there were still sharp upturns in value of the following commodities: textiles and garments (up by USD 426 million); foot-wears (up by USD 132 million); wood and wooden products (up by USD 66 million); coffee (up by USD 63 million).
 
 image006
  
In 2014, there were more 2 exported commodities reaching over USD billion than 2013, to 23commodities. The value of these was expanded by 13.8%, to USD 128.88 billion in total as compared to the result of those in 2013 and accounted for 85.8% total merchandise exports value.      
The performance growth in total exports value of 2014 as compared to that of 2013 was contributed by the upwards of the following goods: textiles and garments (up by USD 3.02 billion); foot-wears (up by USD 1.94 billion); machine, equipment, tools and instruments (up by USD 1.29 billion); fishery products (up by USD 1.14 billion); computers, electrical products and parts thereof (up by USD 838 million)…
    
5 The following Table released by Vietnam Customs illustrates 10 biggest major imported commodities of Vietnam from rest of the world in December 2014. The leading imported products of the country from the world market included: Machine, equipment, tools and instruments (USD 2,408 million); computers, electrical products, spare-parts and components thereof (USD 1,829 million);textiles, leather and foot-wears materials and auxiliaries group (USD 1,460 million); iron and steel (USD 863 million); telephones, mobile phones and parts thereof (USD 1,722 million); …
 
image008
 
In 2014, there were more 5 imported commodities reaching over USD billion than 2013, to 29 commodities. The value of these reached USD 127.05 billion in total as compared to the result of those in 2013 and accounted for 85.8% total merchandise exports value.      
 
The performance growth in total imports value of 2014 as compared to that of 2013 was contributed by the upwards of the following goods: machine, equipment, tools and instruments (up by USD 3.82 billion); computers, electrical products and parts thereof (up by USD 1.44 billion); iron and steels (up by USD 1.12 billion); fabrics (up by USD 1.09 billion);..
On the other hand, there were strong decrease in value of the following goods: other means of transportation, parts and accessories thereof (down by USD 849 million); crude oil (down by USD 571 million) and fertilizers (down by USD 466 million).
 
Trading Partners
 
6. In 2014, Vietnamese merchandise trade with trading partners in Asia was totaled USD 197.26 billion in value terms, which moved up 11.7%  as compared to the same period of one year before. Trade-in-goods of Vietnam with America was followed, which reached USD 46.74 billion and increased by 23.6%. The values of other continents were: Europe: USD 42.59 billion, up by 7.7%; Oceania: USD 6.93 billion, up by 19.1% and Africa: USD 4.71 billion, up by 9.7% in comparison with the performance of 2013.
 
 image010
7. From January to December of 2014, Vietnam traded with over 200 trading partners. There were 28 exporting markets and 18 importing markets with over USD 1 billion revenue.
 
Value level Exports Imports
Markets Value
(Mil.USD)
Markets Value
(Mil.USD)
Above 1 Bil. USD 28 133.98 18 132.78
500 Mil.USD – 1 Bil.USD 7 4.6 9 5.83
100 Mil.USD – 500 Mil.USD 32 7.4 28 6.56
Below 100 Mil. USD 171 4.21 183 2.88
 
                                                                                                Source: Vietnam Customs
 
For Jan – Dec period of 2014, there were 17 exporting markets with trade surplus of over USD 1 billion. The United States of America posted the biggest trade surplus of USD 22.37 billion.  United Arab Emirates and Hong Kong posted the second trade surplus of USD 4.16 billion and then: Netherland (USD 3.22 billion); United Kingdom (USD 3 billion); Germany (USD 2.54 billion)…
 image012


8. In 2014, there were 6 importing markets with trade deficit of over 1 billion. China was the market that Vietnam had the largest trade deficit with USD 28.96 billion. The following positions were: Republic of Korea (USD 14.6 billion); Taiwan (USD 8.78 billion); Singapore (USD 3.93 billion); Thailand (USD 3.86 billion)…
 
 image014